

|
US Region Total Electron Content 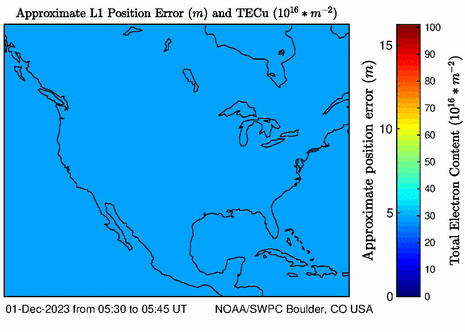
|
Standard Deviation 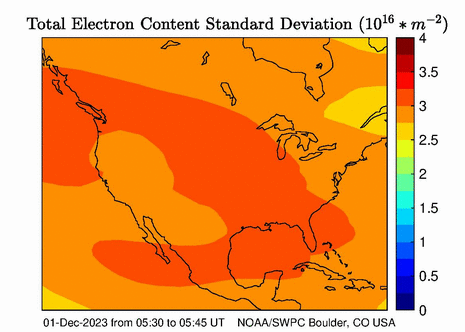
|
Anomaly 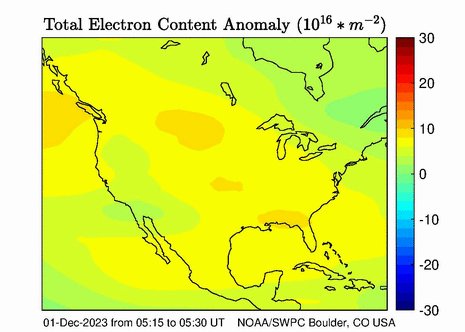
|
The North American Total Electron Content (NA-TEC) product is designed for single and dual frequency GPS applications. It provides a near real-time assessment of the Total Electron Content (TEC) which is often used as a proxy for GPS position error. The TEC maps can be used to estimate the GPS signal delay due to the ionospheric electron content between a receiver and a GPS satellite. This delay can be translated into GPS positioning error. For more quantitative information see the the link to data files under the “Archive” tab which provides not only tabular values of the total electron content, but also values of line-of-sight (LOS) or slant path electron content to each GPS satellite in view over North America.
Users are advised to only use the values over land, and only when sufficient GPS data, marked in red, are available to provide a reliable estimate of TEC. The display and data files cover regions with no available GPS data, however in those regions the model relies on climatology. Values from these regions should generally be ignored as the uncertainty in the modeled TEC is expected to be large.
Several warning flags have been built into the display. If data are unavailable for up to an hour, a banner will warn users that no data have been used in the assimilation cycle. If no data have been available for greater than one hour, a statement with the time the input data have been missing and the latest TEC map are displayed.
The NA-TEC products cover North America, and include: Map of the vertical total electron content (VTEC); Map of an estimate of the TEC uncertainty; Map of the recent deviation from the recent 10-day average. ACSII Data files of the vertical and slant path TEC, Daily EOF, the Coefficients, and the list of stations ingested. For each GPS satellite in view the LOS maps provide 1°x1° two-dimensional grids over North America.
The main display is the map of Vertical TEC for a given 15 minute interval in TEC units (1 TECU=1016; electrons m-2). New maps are normally available about 13 minutes after a given interval, and are updated every 15 minutes. The contour interval is variable, but is typically about 1 TEC unit up to 20 TEC, with gradually increasing contour intervals for values above 20 TEC units. The map also displays the GPS sites used in the current assimilation cycle, using different symbols for each network.
The accuracy of GNSS positioning depends on the precise determination of the travel time the radio signal takes to propagate from the satellite transmitter to the receiver. The propagation time is increased by the presence of plasma. The increase in propagation time is in the first approximation proportional to the total electron content (TEC). TEC varies on timescales from minutes to months and years. Knowledge of TEC can improve positioning accuracy.
The North American Total Electron Content (NA-TEC) product, which evolved through a collaboration between the Space Weather Prediction Center (SWPC), the National Geodetic Survey (NGS), the National Geophysical Data Center ( NGDC), and the Global Systems Division (GSD), is designed to specify Vertical and Slant TEC over North America in near real-time. The product uses a Kalman Filter data assimilation model, described in the Technical Documentation (Validation Documentation, Product Description, and Technical Documentation). NA-TEC superseded United States Total electron Content (US-TEC) in 2015. The changes introduced with NA-TEC are a larger assimilation grid and the addition of new GPS data in Alaska, Hawaii, Canada, and Mexico.
This technique is driven by data from ground-based Global Positioning System (GPS) dual frequency receivers. Currently, there are about 125 CORS, 15 GPS/Met, 10 RTIGS, and 12 WAAS stations ingested into the model. This number has been gradually increasing and will be augmented by Federal Aviation Administration/Wide Area Augmentation System (FAA/WAAS) data, etc.
Input Files: The basic data ingested by NATEC are ground-based GPS receiver data from three different sources:
CORS (Continuously Operating Reference Stations, https://www.ngs.noaa.gov/CORS/data.shtml),
CORS/MET (Ground-Based GPS Meteorology, https://madis.ncep.noaa.gov/madis_gpsmet.shtml),
and RTIGS (Real Time International GNSS Service, https://cddis.nasa.gov/Data_and_Derived_Products/GNSS/orbit_products.html).
The system also requires other data for the processing;
the satellite coordinates are obtained from SP3 files from JPL (https://cddis.nasa.gov/Data_and_Derived_Products/GNSS/orbit_products.html),
the satellite biases are downloaded from the University of Bern (http://ftp.aiub.unibe.ch/),
and the RZ12 solar index is obtained from the NASA IRI’s site (ftp://nssdcftp.gsfc.nasa.gov/models/ionospheric/iri/iri2001/fortran_code/).
Data Files: These links provide access to the latest data files for:
the Daily Empirical Orthonormal Functions (EOFs),
the Coefficients for the EOFs,
the tabular values of vertical TEC and slant path TEC,
Recent Trend ( expressed as the difference between the current TEC and the previous 10-day average),
and the list of stations used for the assimilation for each time interval.