

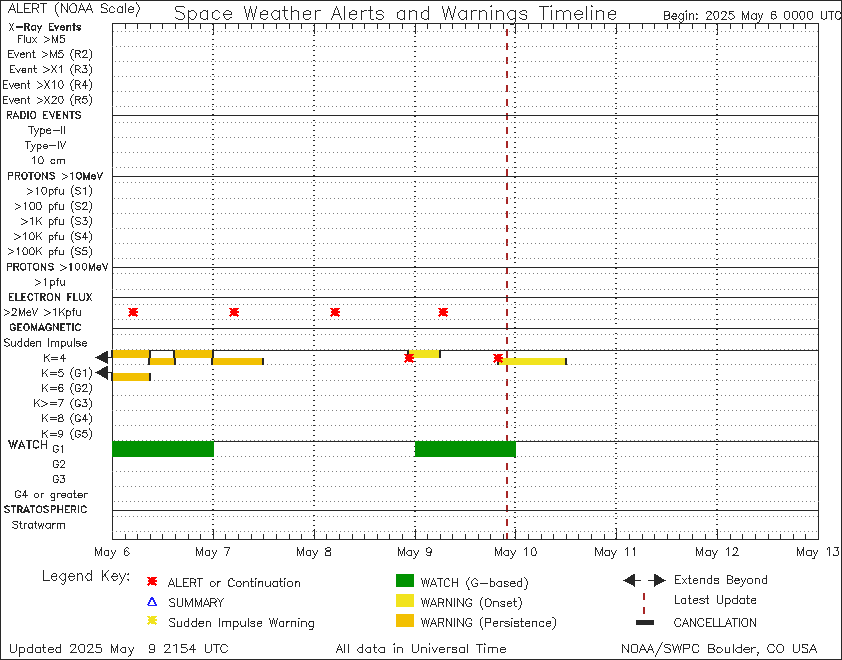
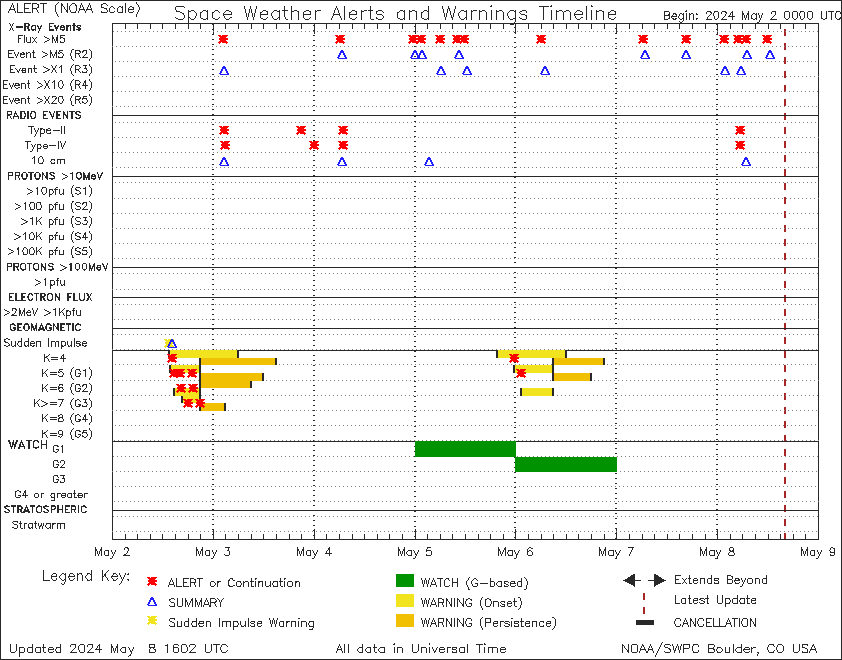
The Alerts Timeline is a graphical presentation of the Space Weather Alerts issued by SWPC, that give forecasters and users alike a quick look at the Alerts and warnings issued over a ten day period. There are two plots, each depicting seven days of time. The top plot displays seven days, centered on the current day, showing the products issued and valid for today and the next three days. The bottom plot displays the last six days plus the current day, showing the products issued over the past week.
The symbols that appear along the various rows in the plot represent the event-based products which have been issued due to occurrences of the various kinds of space weather phenomena shown in the adjoining row labels. Where applicable, the row labels include the corresponding NOAA Space Weather Scale value in parenthesis. Current time (in Coordinated Universal Time -- UTC) is indicated by the dashed, dark red vertical line appearing in the block corresponding to the current day.
Because of the unique characteristics of these different kinds of space weather events, and our ability to detect or describe certain aspects of them, specific rows in the plot will only contain the symbols that correspond to the proper products for that phenomena. There is also a general order of precedence controlling which symbols are plotted "on top" of others.
The types of alerts, their symbols, and their associated space weather events are lists here and described below. Symbols are plotted at the Issue Time of the alert, except for Watches and Onset/Persistence Warnings, as described below:
WATCHES:
- A-index values >= 20, 30, 50, and 100
WARNINGS (Onset or Persistence, including Extensions):
- 10MeV Protons >= 10pfu;
- 100MeV Protons >= 1pfu; and
- K-index values = 4, 5, 6 and >= 7.
WARNINGS (single symbol only):
- Sudden Impulse
ALERTS (including Alert Continuations for Protons):
- X-ray Flux >= M5
- Type-II and Type-IV Radio Sweeps;
- 10MeV Protons >= 10pfu, 100pfu, 1Kpfu, 10Kpfu, 100Kpfu;
- 100MeV Protons >= 1pfu;
- 2MeV Electrons >= 1Kpfu
- K-index values = 4, 5, 6, 7, 8, 9
- Stratospheric Stratwarm
SUMMARIES:
- X-ray Events >= M5, X1, X10, X20
- 10cm Radio Burst
- 10MeV Protons >= 10pfu, 100pfu, 1Kpfu, 10Kpfu, 100Kpfu;
- 100MeV Protons >= 1pfu;
- Sudden Impulse
CANCELATIONS:
- All rows (any product may be "canceled")
WATCHES are a bar-plot for the calendar day involved. A-index predictions based on SWPC's daily space weather forecast and analysis.
Onset and/or Persistence WARNINGS are often extended several times over the course of a space weather event. To aid in the interpretation of the product timeline for these warnings, they are bars plotted in a staggered up-down fashion along individual rows, and include black "bookends" to indicate their effective start and end times. All initial warnings are plotted for their "Valid From - Valid To" times, while all Extensions are plotted for their "Issue Time - Now Valid Until" times (Extended Warnings always have the same "Valid From" time as the initial warning, and may only be issued prior to the expiration of the latest valid warning period in effect). Warnings may have valid periods that extend before or after the time shown in the plot, and in these cases an arrow symbol appears at the appropriate end of a row in the plot.
Sudden Impulse WARNINGS generally apply to a fairly short warning interval and are not extendable, so on the time scale of these plots, they are more effectively displayed as single symbols, plotted at their Issue Time. If a Sudden Impulse does occur, an appropriate SUMMARY symbol will be plotted for its issue time as well, so under the best circumstances, the warning and summary symbols will appear in pairs for Sudden Impulse events.
ALERTS appear for X-ray Flux >=M5 and over the course of Proton and K-index events, due to the rules that govern their issue. Since Proton events may be long-lived, CONTINUED ALERTS follow the initial alert near the beginning of each UT day, for the highest threshold in effect when such events remain in progress. Lower K-index values (K= 4 and 5) only require the issue of one initial ALERT per a corresponding valid warning period. However higher K-index values (6 and above) require an ALERT for each synoptic (3-hour) period they are observed, regardless of corresponding warning periods.
SUMMARIES describe event particulars after-the-fact. Certain kinds of events are best reported as Summaries, since they require end-of-event information in order to be fully identified as an “event”. These include Sudden Impulses (described above) and 10cm Radio Bursts, neither of which have accompanying Alerts. Summaries are also issued for X-ray Flares and Proton Events, but these phenomena do have accompanying Alerts, which are first issued near their start times. For X-ray events, a >=M5 Flux Alert usually appears in its row ahead of a corresponding event Summary, which appears in the appropriate maximum flux flare event row. Proton events (at all thresholds) always have initial Alerts (and possibly, Continued Alerts) appearing in their rows before a final event Summary is issued for the threshold involved, after flux levels have fallen below that level.
CANCELATIONS are plotted at their Issue Time and are used for two general purposes. The most common use is to prematurely end a valid warning period that may be in effect, so a cancelation symbol will often appear near the end of a warning timeline for Proton Events or K-index (geomagnetic storm) events. In the case of Protons, there will often be an accompanying SUMMARY of the event plotted nearby. The other general purpose of cancelations is to retract a product due to an error. In such cases, a symbol indicating a subsequent, corrected product may also appear nearby.
There are Archived Alert Timelines showing a graphical history of SWPC Alerts issued since February 2002.
SWPC maintains an archive of SWPC products, including Alerts and Warnings. Also available are the NOAA Scales description.