

|
Magnetic Perturbations over North America 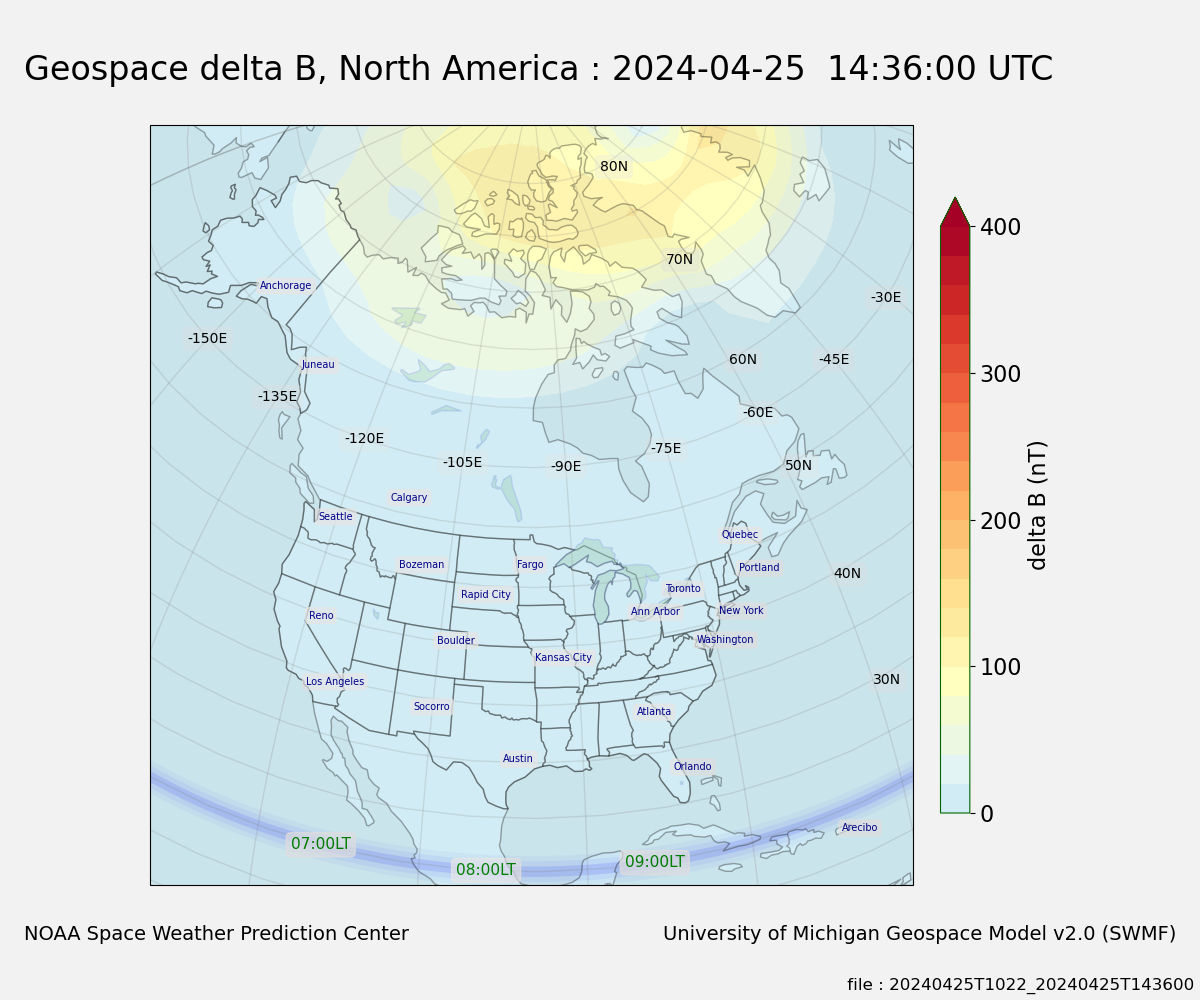
|
|
Magnetic Perturbations over the Globe 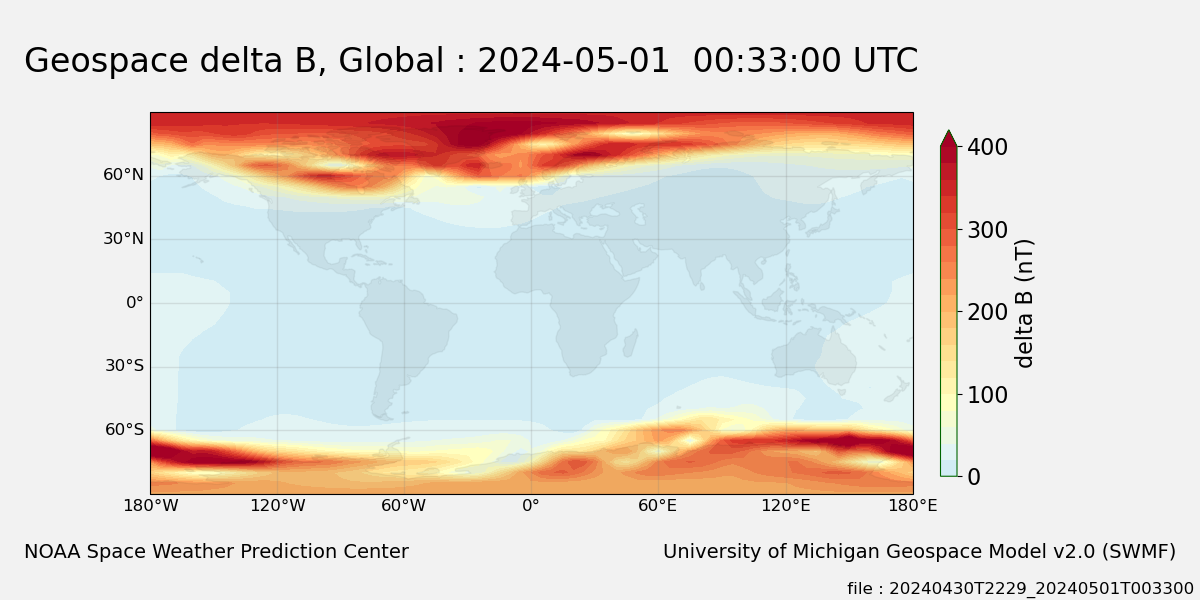
|
|
Magnetic Perturbations over the Poles 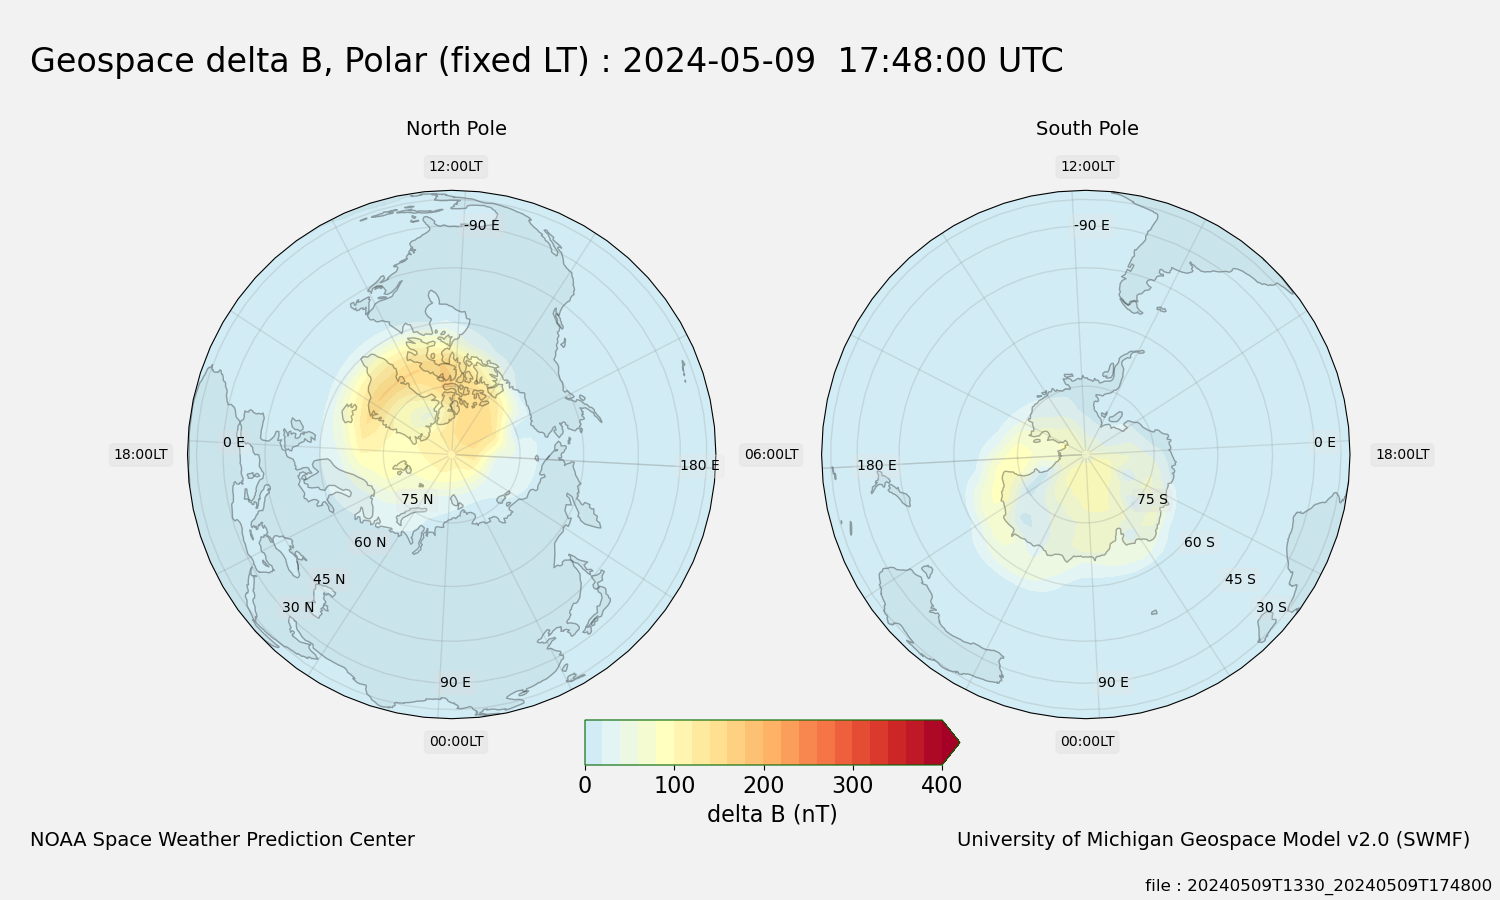
|
The Geospace Ground Magnetic Perturbation Maps display the gridded magnetic delta B (nT) output from the University of Michigan’s Geospace model, which provides regional magnetic variations on a five-by-five degree global grid. Using these data, colored contour plots of the predicted delta B are generated for three different views: delta B over North America (top panel), a global view of delta B (middle panel), and a dual polar view of the north and southern hemispheres oriented in fixed local time (bottom panel). The animations show the model forecast, where the lead time depends on the solar wind speed, as well as the previous two hours for context.
Ground magnetic perturbation maps such as those displayed here are useful for providing regional disturbance model forecasts that can be used by power grid operators to determine if disturbances are likely to have impacts at their general location.
For additional space weather products generated using output from the Geospace model, see the following pages:
This product uses output generated by the University of Michigan’s Geospace model that consists of several components in their Space Weather Modeling Framework (SWMF). The Geospace model is a first-principles physics-based model which includes three components:
- The University of Michigan’s BATS-R-US magnetohydrodynamic (MHD) model of the magnetosphere
- The Ridley Ionosphere electrodynamics Model (RIM) developed at Michigan
- The Rice Convection Model (RCM), an inner magnetosphere ring-current model developed at Rice University
For local magnetic perturbations, the magnetic field on the ground is not directly modeled; instead, the magnetic disturbances are derived from currents in the MHD domain, the field-aligned currents (FACs) in the gap region between the MHD domain and the ionosphere, and the ionospheric Hall and Pedersen currents. The gap region is located between the inner boundary of the MHD model at 2.5 Re and the ionosphere model at ~1 Re. In the gap region the field aligned currents are assumed to flow roughly along the dipole field.
The Geospace Ground Magnetic Perturbation Maps represent the first generation of operational space weather products derived from the Geospace model, a model which includes both global and regional short-term predictions of geomagnetic activity. Other operational space weather products generated using output from the Geospace model include the Geospace Global Geomagnetic Activity Plot and the Geospace Magnetosphere Movies.
The Geospace model (v1.0) first went operational in October 2016, and during its first year in operations the model achieved initial success in providing forecaster guidance on levels of regional geomagnetic activity, short-term predictions of geomagnetic indices, and making data available to customers over the web.
As of November 8, 2017, the operational product was driven by the Geospace model (v 1.5). This first upgrade to the Geospace model included some minor physics improvements, new output parameters, increased model robustness, and a switch to a different operational high-performance computer (Cray). In addition, this version of the model allowed for the model to perform a warm restart from a previous output file during times when there was a solar wind data gap of greater than 15 minutes and less than 2 hours. Solar wind data gaps of greater than 2 hours continue to trigger the model to perform a cold restart, which can require 2-3 hours for the model to return to equilibrium.
As of January 25, 2021, the operational products are now being driven by the Geospace model (v2.0). In this upgrade to the Geospace model, the most significant changes are: increased resolution for solving the MHD equations in targeted regions of the grid, moving from ~ 1 million to 1.9 million grid cells; improved auroral oval specification and more realistic representation of magnetospheric current systems; new tail composition settings to better represent current systems responsible for the Disturbance Storm Time index – Dst; a new method for calculating a predicted estimated Kp (global geomagnetic activity index) based on magnetic variations from the Geospace model processed by a Kp algorithm that is the same as SWPC uses for calculating Kp from ground-based magnetometer stations.
The model output files for the last 48 hours can be accessed here.