

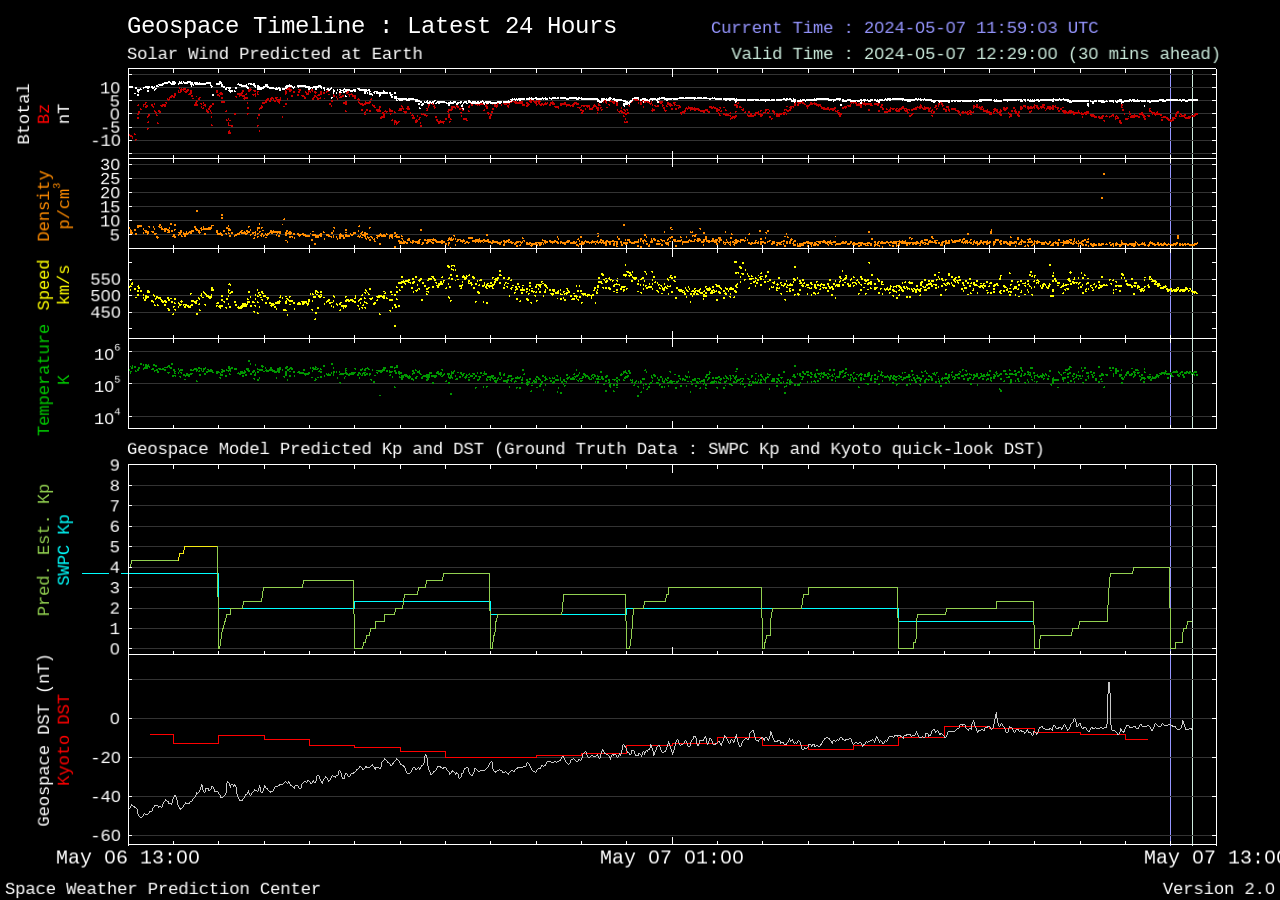
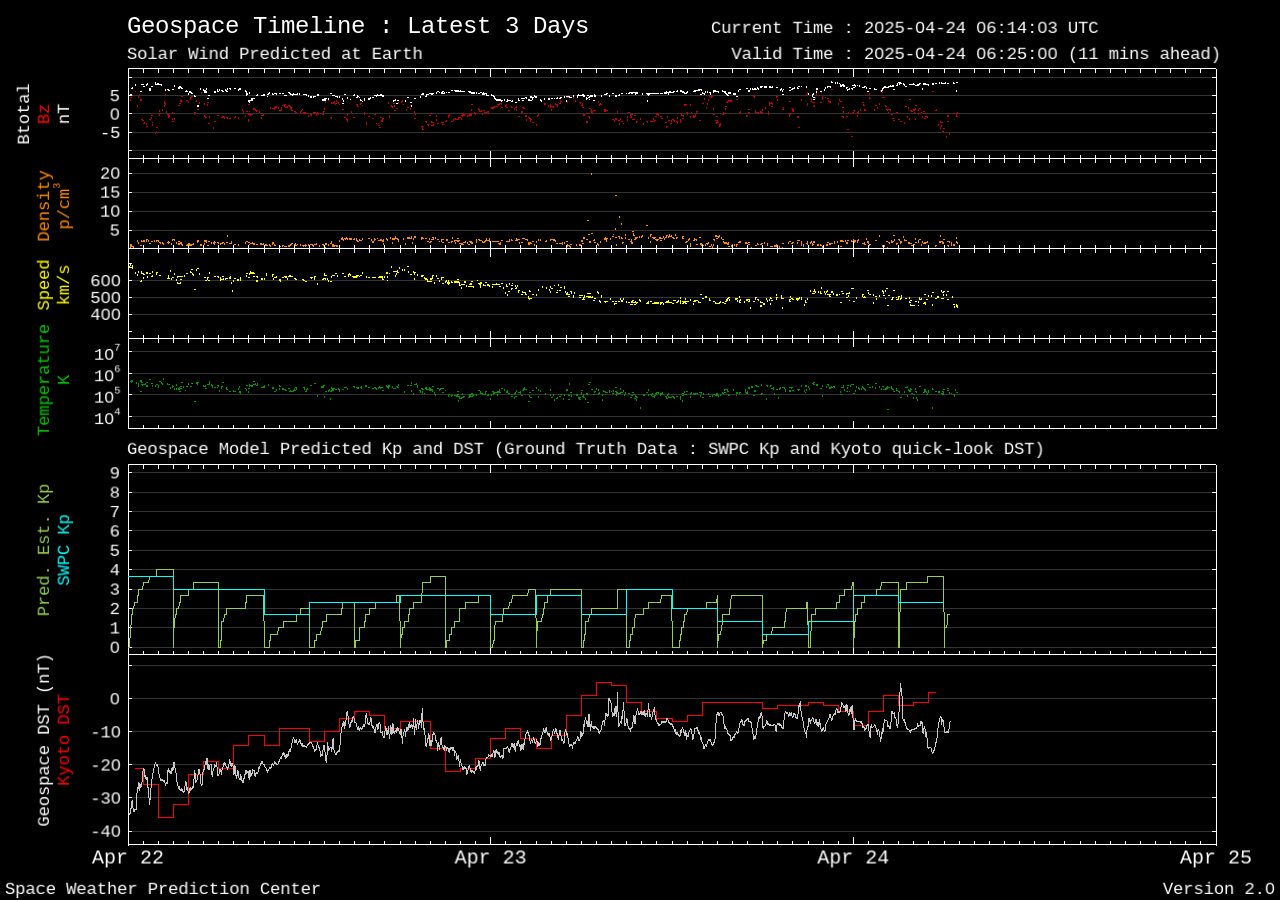
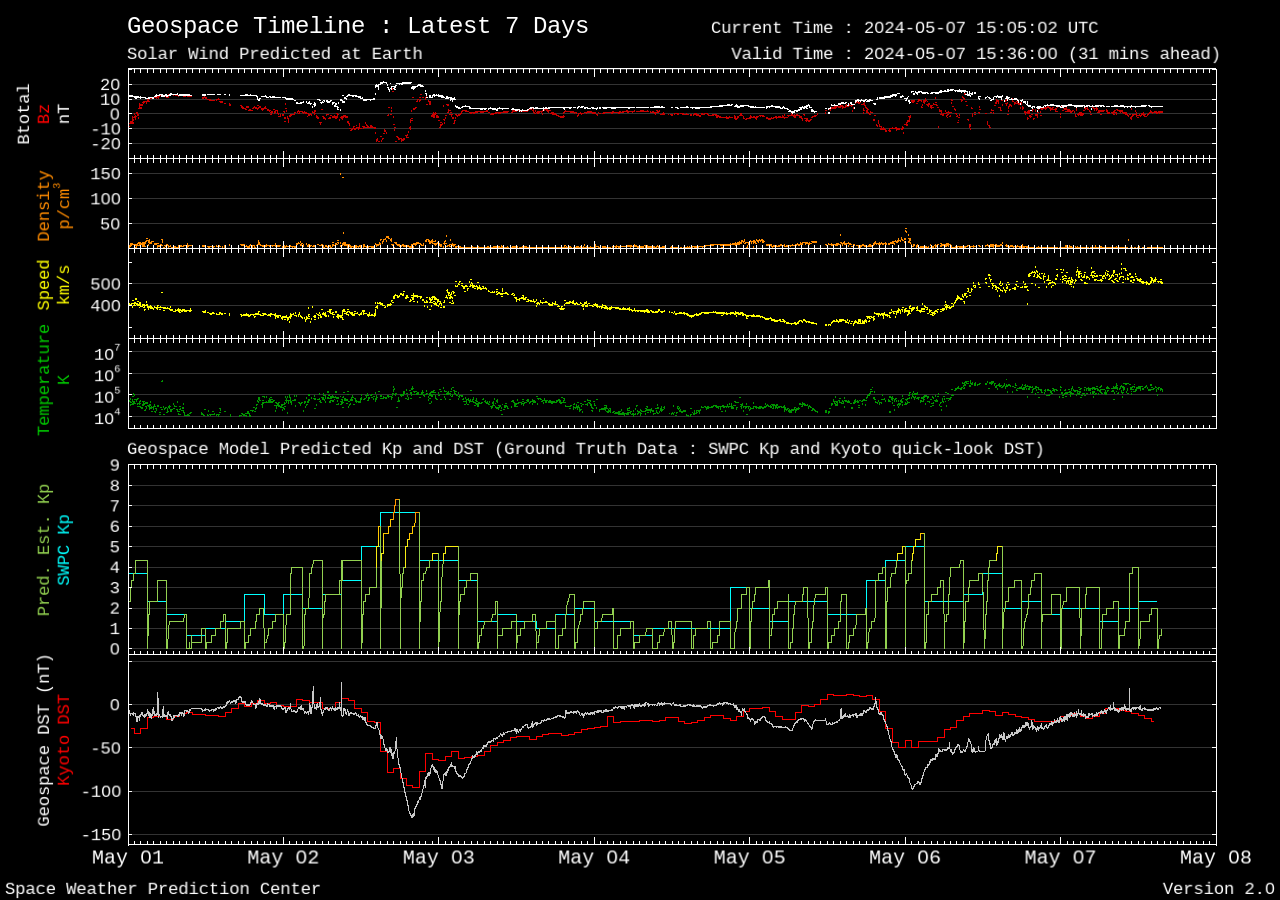
The Geospace Global Geomagnetic Activity Plot displays real-time solar wind values ballistically propagated from L1 orbit to 32 Re at the upstream boundary of the University of Michigan’s Geospace model (top four panels). The propagated solar wind values are used to drive the University of Michigan’s Geospace model which outputs 1-minute predicted estimated Kp and Dst values (bottom two panels). In addition to the forecast values for Kp (green line) and Dst (white line), the ground truth data for Kp (SWPC estimated 3-hour Kp; teal line) and Dst (Kyoto 1-hour quick look Dst; red line) are plotted for comparison.
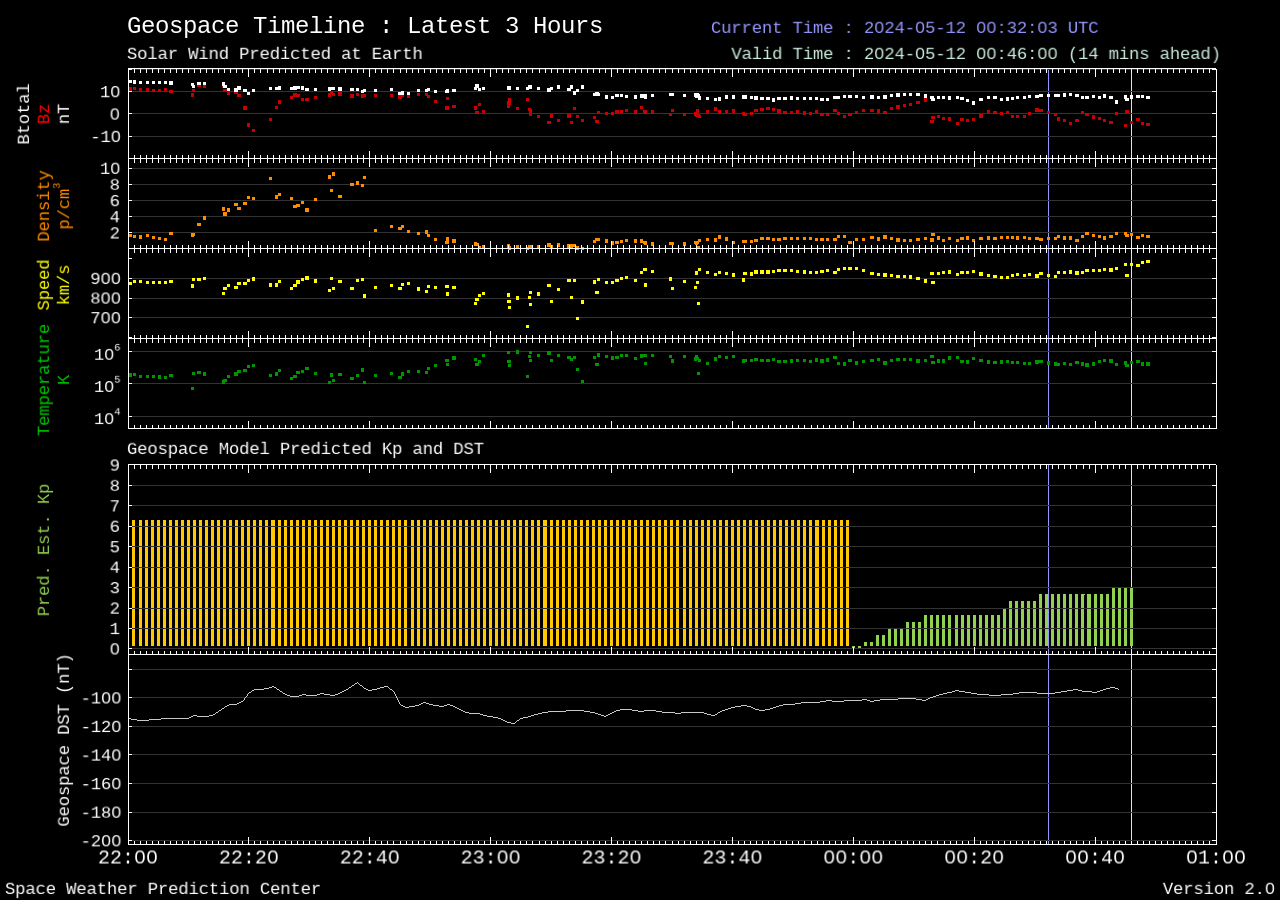
The vertical purple line (on the 3-hour and 1-day plots) indicates the current time, and the data plotted to the right of the purple line shows the forecast for a short-timescale prediction at Earth. The Geospace model can provide Kp and Dst forecasts with approximately 30 to 60 minutes advanced warning, depending on the speed of the solar wind. Global activity indices, such as the geomagnetic activity index Kp and the disturbance storm time index Dst, are useful for a wide customer base as well as for indicators of how well the model is performing.
For information about the official Kp index, please visit the official Kp index web page at the German Research Centre for Geosciences (GFZ).
Dst values are obtained from the World Data Center for Geomagnetism in Kyoto. These are Quicklook Dst values and as such, these values are unverified, may contain inaccuracies, and are subject to change.
*** Note that these plots do not display the official SWPC forecast, instead they display model guidance which forecasters can use to assist them in generating the official forecast. Also note that cold restarts of the Geospace model can occur when there is no solar wind data for more than 2 hours. When this occurs the model predicted Kp and Dst values go to zero and it can take several hours, or more, depending on the level of geomagnetic activity, before the model returns to equilibrium.
For additional space weather products generated using output from the Geospace model, see the following pages:
This product uses output generated by the University of Michigan’s Geospace model that consists of several components in their Space Weather Modeling Framework (SWMF). The Geospace model is a first-principles physics-based model which includes three components:
- The University of Michigan’s BATS-R-US magnetohydrodynamic (MHD) model of the magnetosphere
- The Ridley Ionosphere electrodynamics Model (RIM) developed at Michigan
- The Rice Convection Model (RCM), an inner magnetosphere ring-current model developed at Rice University
The calculation of the predicted estimated Kp index is similar to the calculations of the real Kp index and begins with determining the north and east components of the magnetic field disturbance from background. However, within SWMF no background field subtraction is required for the virtual magnetometers as they only report the predicted disturbance. The Geospace model Version 2.0 representation of predicted estimated Kp (shown here) is different from the previous version 1.5. The new approach, called 'predicted-estimated Kp' uses model magnetic variation output from station locations that are the same as the magnetometer observatories used by SWPC for calculating the observed real-time Kp estimate. Furthermore, it follows the conventions of using fixed, three-hour synoptic periods and resetting every time a new synoptic period begins. As each 3-hour synoptic period progresses, the maximum and minimum of both north and east components are tracked. Between the north and east components, the largest difference between maximum and minimum is selected, and this is then converted to a K number using a semi-logarithmic scaling. A scaling factor is used in order to obtain the desired occurrence distribution of K 1 through 9.
The calculation of the Geospace model Dst is for the perturbation at the center of the Earth for which all currents in the MHD domain are included, i.e. the field-aligned currents (FACs) up to the inner boundary, the magnetopause current and other currents. Currents within the gap region and ionospheric currents are not included in the calculation of the predicted Dst.
The Geospace Global Geomagnetic Activity Plot represents the first generation of operational space weather products derived from the Geospace model, a model which includes both global and regional short-term predictions of geomagnetic activity. Other operational space weather products generated using output from the Geospace model include the Geospace Ground Magnetic Perturbation Maps and the Geospace Magnetosphere Movies.
The Geospace model (v1.0) first went operational in October 2016, and during its first year in operations the model achieved initial success in providing forecaster guidance on levels of regional geomagnetic activity, short-term predictions of geomagnetic indices, and making data available to customers over the web.
As of November 8, 2017, the operational product was driven by the Geospace model (v 1.5). This first upgrade to the Geospace model included some minor physics improvements, new output parameters, increased model robustness, and a switch to a different operational high-performance computer (Cray). In addition, this version of the model allowed for the model to perform a warm restart from a previous output file during times when there was a solar wind data gap of greater than 15 minutes and less than 2 hours. Solar wind data gaps of greater than 2 hours continue to trigger the model to perform a cold restart, which can require 2-3 hours for the model to return to equilibrium.
As of February 3, 2021, the operational products are now being driven by the Geospace model (v2.0). In this upgrade to the Geospace model, the most significant changes are: increased resolution for solving the MHD equations in targeted regions of the grid, moving from ~ 1 million to 1.9 million grid cells; improved auroral oval specification and more realistic representation of magnetospheric current systems; new tail composition settings to better represent current systems responsible for the Disturbance Storm Time index – Dst; a new method for calculating a predicted estimated Kp (global geomagnetic activity index) based on magnetic variations from the Geospace model processed by a Kp algorithm that is the same as SWPC uses for calculating Kp from ground-based magnetometer stations.
The model output files for the last 48 hours can be accessed here.
For further information about the Kp index, please visit the official Kp index webpage at the German Research Centre for Geosciences (GFZ).
Planetary K-index data is also available via the National Centers for Environmental Information (NCEI).