

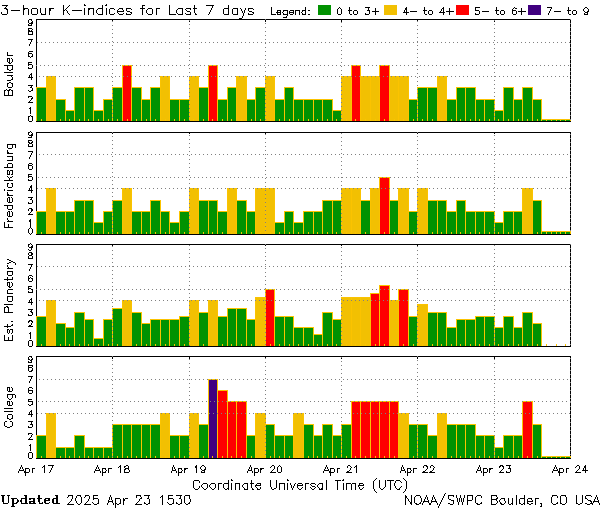
Station K Indices
Station A Indices
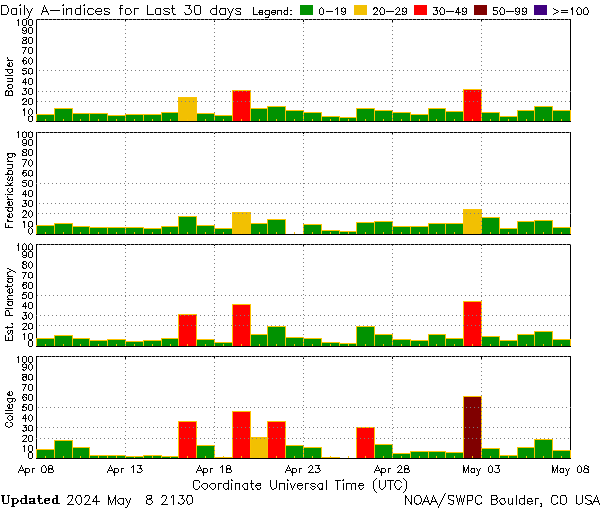
The Station A and K indices show the fluctuations in the magnetic field, tied to specific geographic locations. The indices have a range from 0 to 9 and are directly related to the maximum amount of fluctuation (relative to a quiet day) in the geomagnetic field over a three-hour interval.
The K-index
The K-index is a code that is related to the maximum fluctuations of horizontal components observed on a magnetometer relative to a quiet day, during a three-hour interval. The conversion table from maximum fluctuation (nT) to K-index, varies from observatory to observatory in such a way that the historical rate of occurrence of certain levels of K are about the same at all observatories. In practice this means that observatories at higher geomagnetic latitude require higher levels of fluctuation for a given K-index. At SWPC, we monitor the preliminary values of the K-index, minute by minute, from a network of observatories that relay data in near-real time. The final K-indices are determined after the end of prescribed three hourly intervals (0000-0300, 0300-0600, ..., 2100-2400). The maximum positive and negative deviations during the 3-hour period are added together to determine the total maximum fluctuation. These maximum deviations may occur anytime during the 3-hour period.
ak Index
The ak index is a 3-hourly ”equivalent amplitude” index of geomagnetic activity for a specific station expressing the range of disturbance in the horizontal components. ”ak” is scaled from the 3-hourly station K-index according to the following table:
K 0 1 2 3 4 5 6 7 8 9
ak 0 3 7 15 27 48 80 140 240 400
The ak values can be converted to nanoteslas (nT) using a local, station-dependent conversion factor. The conversion factor is found by dividing the station’s lower limit for K=9 by 250. For example, at Boulder and Fredericksburg the lower limit for K=9 is 500 nT so the factor is 2; therefore the ak values for these stations are in units of 2 nT. (To obtain an equivalent amplitude in nanotesla for Boulder or Fredericksburg, the index value must be doubled.)
A index
The A-index is calculated for individual magnetometer stations. The value is calculated as the average of eight, three-hourly station ak-indices observed during a UT day, and provides a single, average value to indicate the activity level for that day.
The Kp-index
The planetary Kp-index is a globally averaged indicator of the worldwide level of geomagnetic activity. The official Kp index is derived by calculating a weighted average of K-indices from a predetermined network of geomagnetic observatories, the official Kp network. Since some of these observatories are not currently available to SWPC in real-time, it is necessary for an operations center such as ourselves to make the best estimate we can of this index from a subset of the official network. The Space Weather Prediction Center calculates near real-time estimates of the Kp index using eight of the thirteen official Kp network stations. The network of contributing stations is provided through cooperative efforts between SWPC and data provider partners which currently include the U.S. Geological Survey, Natural Resources Canada, the British Geological Survey, German Research Centre for Geosciences (GFZ), Geoscience Australia, with important supplemental contributions from the Institut de Physique du Globe de Paris, and the Korean Space Weather Center.
Using minute-by-minute station K-indices, SWPC monitors the estimated Kp index in near real-time and issues alerts when thresholds are crossed. A complete description of SWPC alerts, watches and warnings are on the web pages: www.swpc.noaa.gov/alerts/.
In addition, the end-of-period NOAA estimated Kp index is used on our announcements and appears on our web site.
Users interested in the official Planetary Kp index should refer to the following web page: https://www.gfz.de/en/section/geomagnetism/data-products-services/geomagnetic-kp-index
Ap index
The Ap index is derived from the Kp index in a way that is analogous with the relationship between the station K-index and station A-index. Each individual, three-hourly Kp index is converted to an equivalent amplitude three-hourly akp index, and the average of eight, three-hourly akp indices is calculated to produce the 24 hour Ap index. (The conversion table and further details may be found in Mayaud, 1980, page 47). Since NOAA/SWPC uses a subset of the official network for estimating Kp, a similar limitation applies and therefore the values on the NOAA/SWPC website should be considered to be estimates of the Ap-index. The value of this estimated Ap index is reported in NOAA daily and weekly summaries of geophysical activity.
The relationship between K and A
The A-index was invented because there was a need to derive some kind of daily average level for geomagnetic activity. Because of the non-linear relationship of the K-scale to magnetometer fluctuations, it is not meaningful to take averages of a set of K indices. What is done instead is to convert each K back into a linear scale called the "equivalent three hourly range" a-index (note the lower case). The daily A index is merely the average of eight, three-hourly "a" indices.
Limitations
Due to real-time requirements for the information, our alerts have to be based on measurements from the contributing real-time magnetometer network. This usually works fine but there can be small differences between the real-time estimate and the official value since the network of observatories is not identical. Users should also beware that a localized disturbance may occur which could affect a customer's region of operations, and yet not be indicated in the globally averaged index. The NOAA scale describes general effects for various levels of activity, but with regards to geomagnetic activity, it needs to be kept in mind that there can be differences in the response that are a function of the location of the user.
Flles containing the A and K indices over various time periods are available from SWPC, including:
2-day Geomagnetic A and K indices from the U.S. Geological Survey Stations;
7-day Geomagnetic A and K indices from the U.S. Geological Survey Stations;
Daily A and K Index values for the last 30 days for middle and high latitudes and the whole planet;
and
Geomagnetic A and K indices back to 2010, from the SWPC FTP Warehouse.
The National Centers for Environmental Information (NCEI) is the official archive for geomagnetic data, including the A and K indices.