

- Neutral Atmosphere Nowcast
- Global Ionosphere Nowcast
- Neutral Atmosphere Forecast
- Global Ionosphere Forecast
Neutral Atmosphere Nowcast 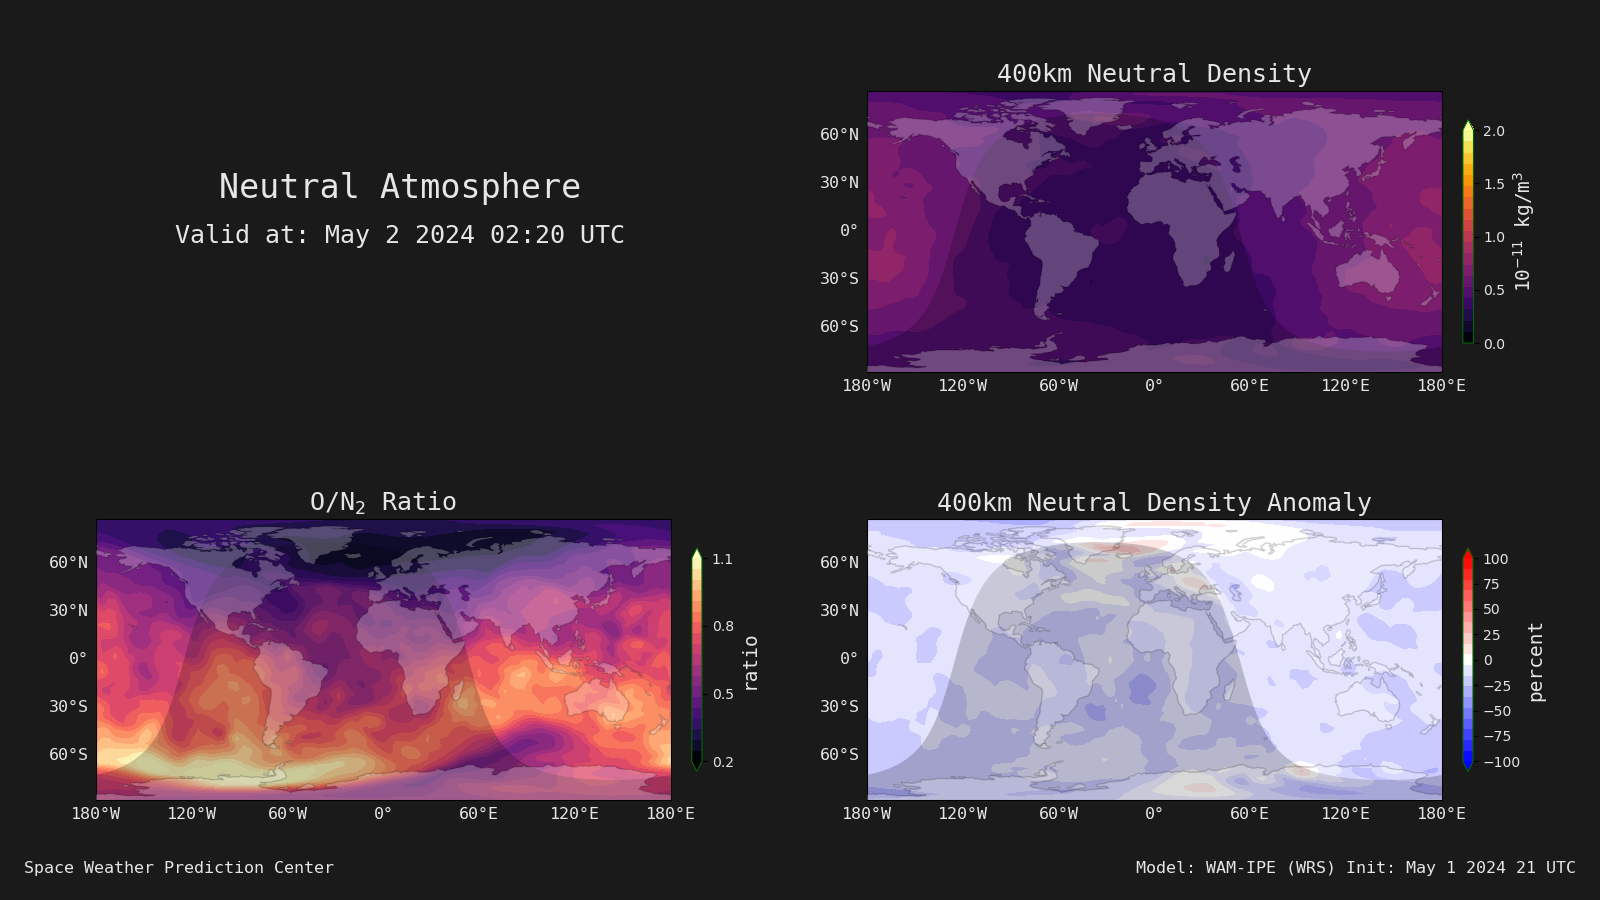 |
Ionosphere Nowcast 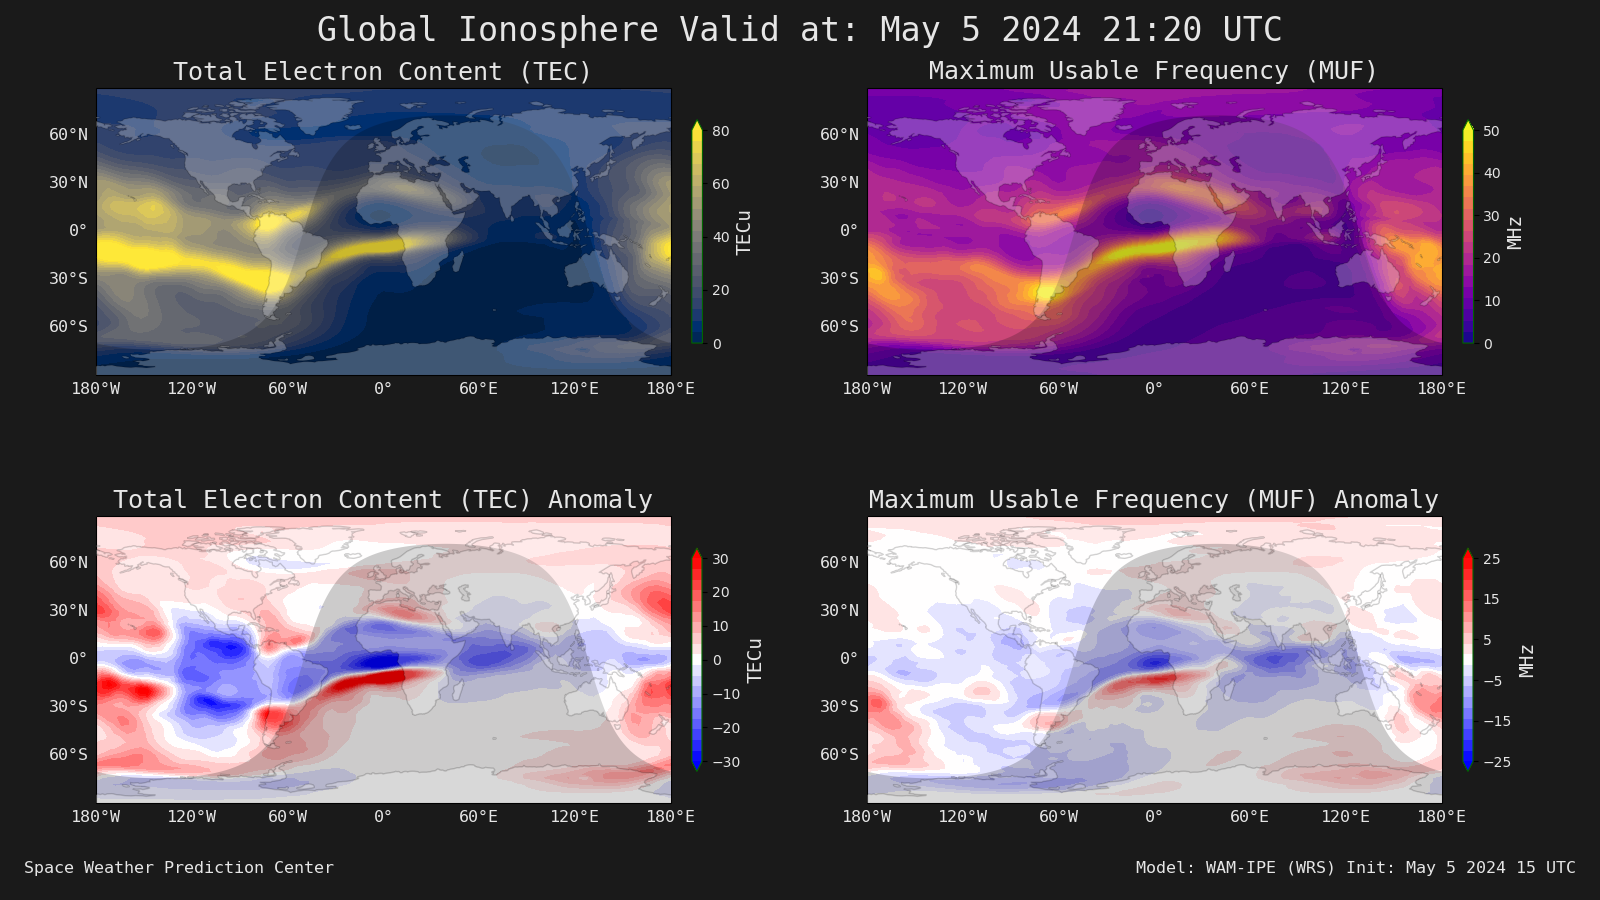 |
Latest Neutral Atmosphere Forecast 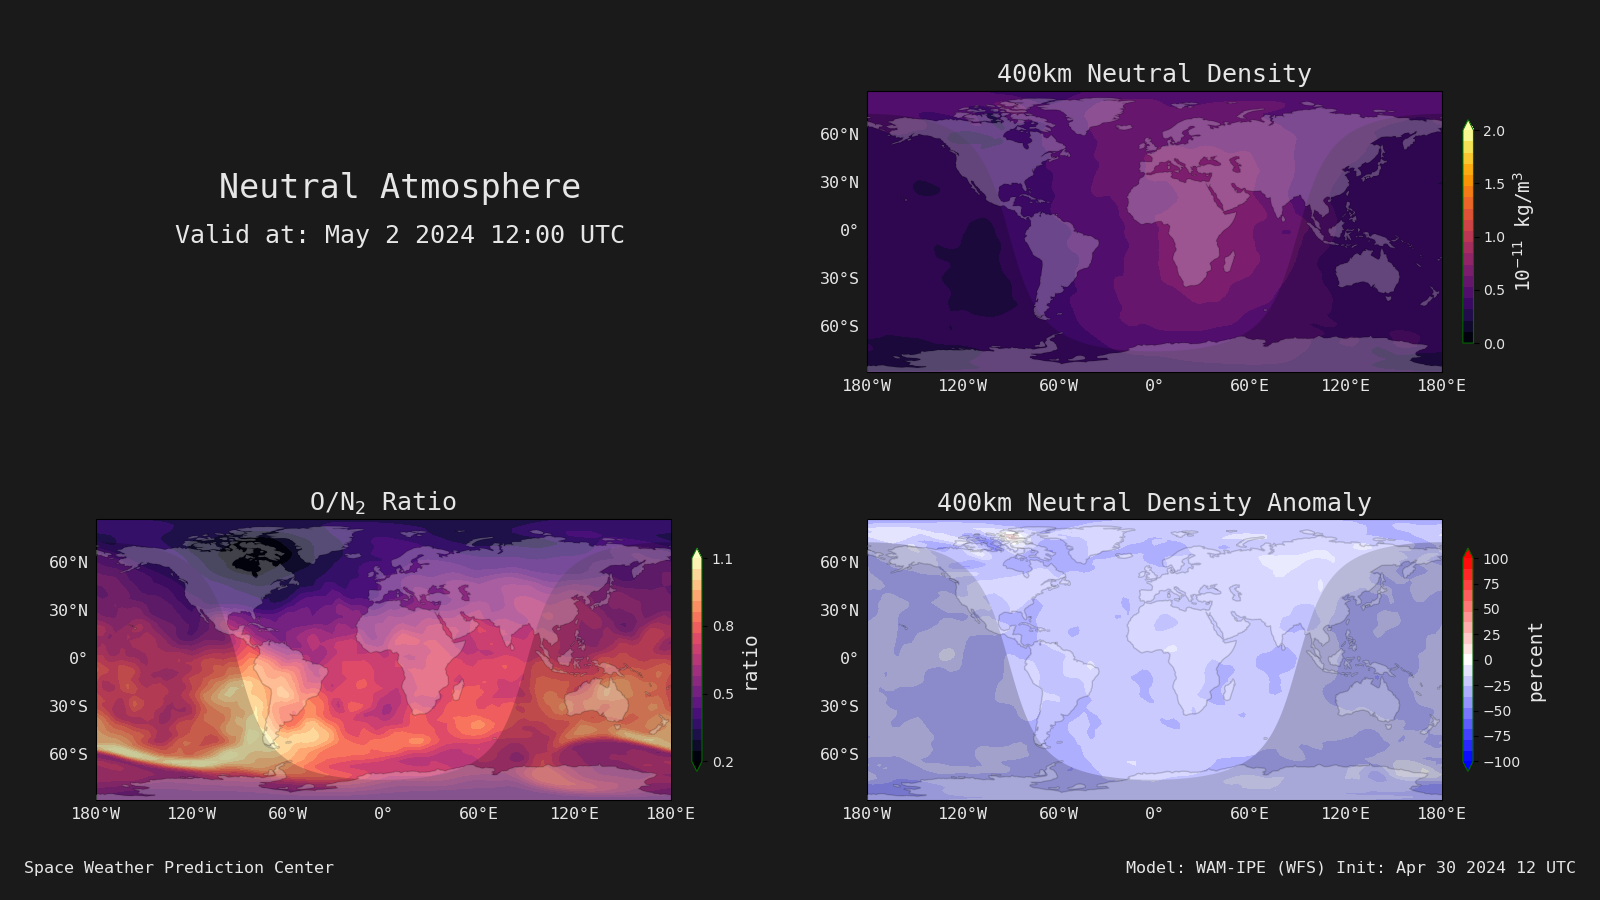 |
Prev Neutral Atmosphere Forecast 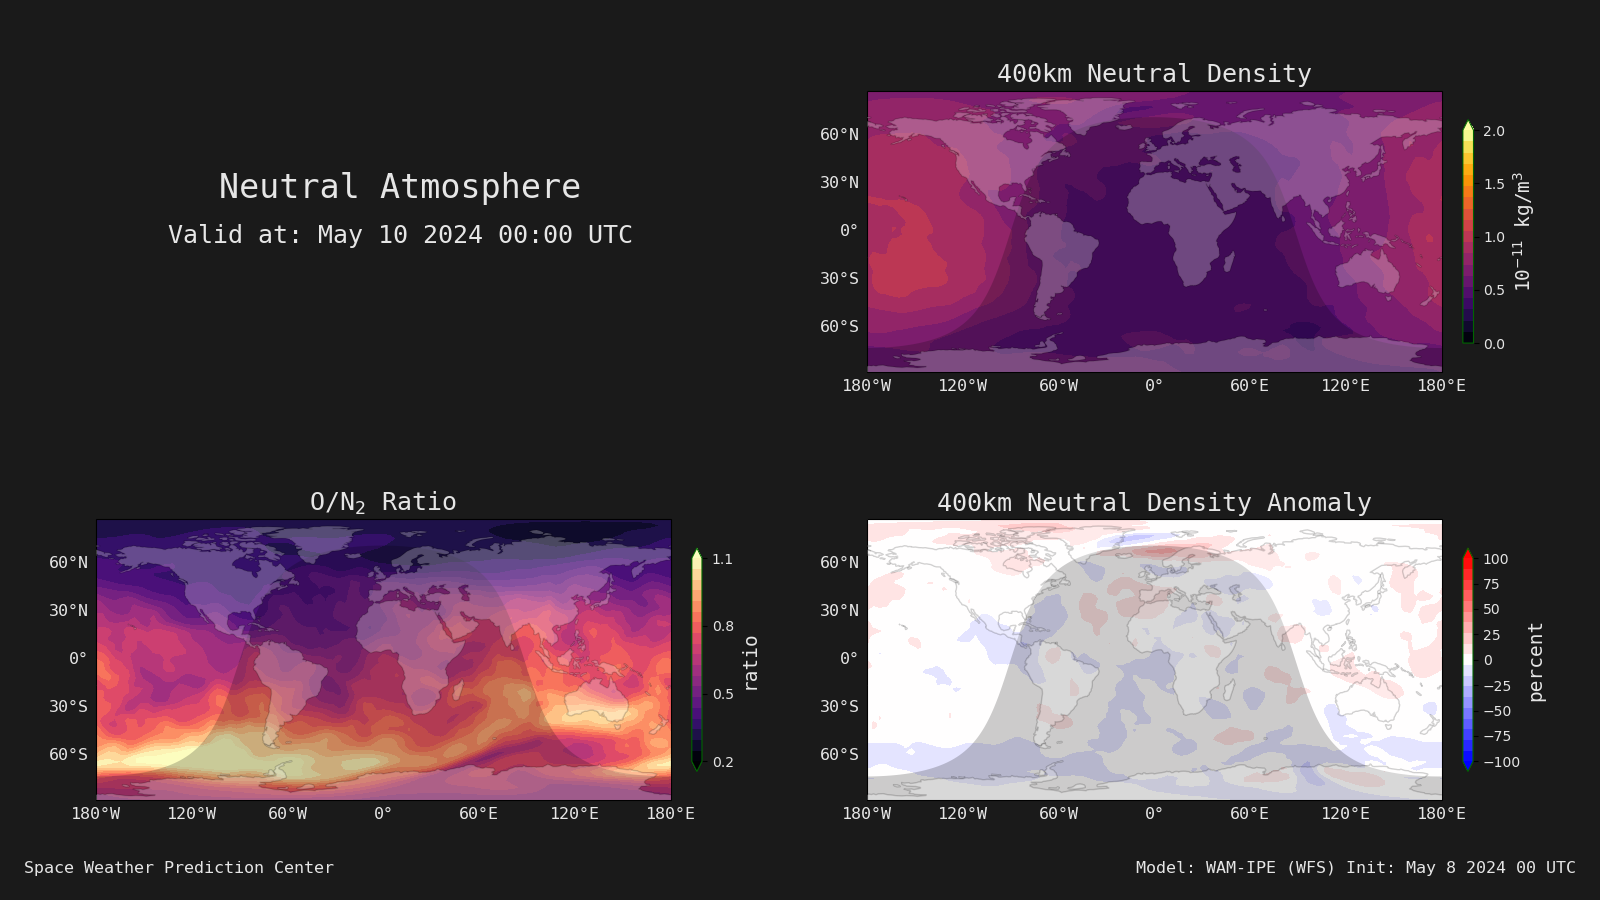 |
Latest Ionosphere Forecast 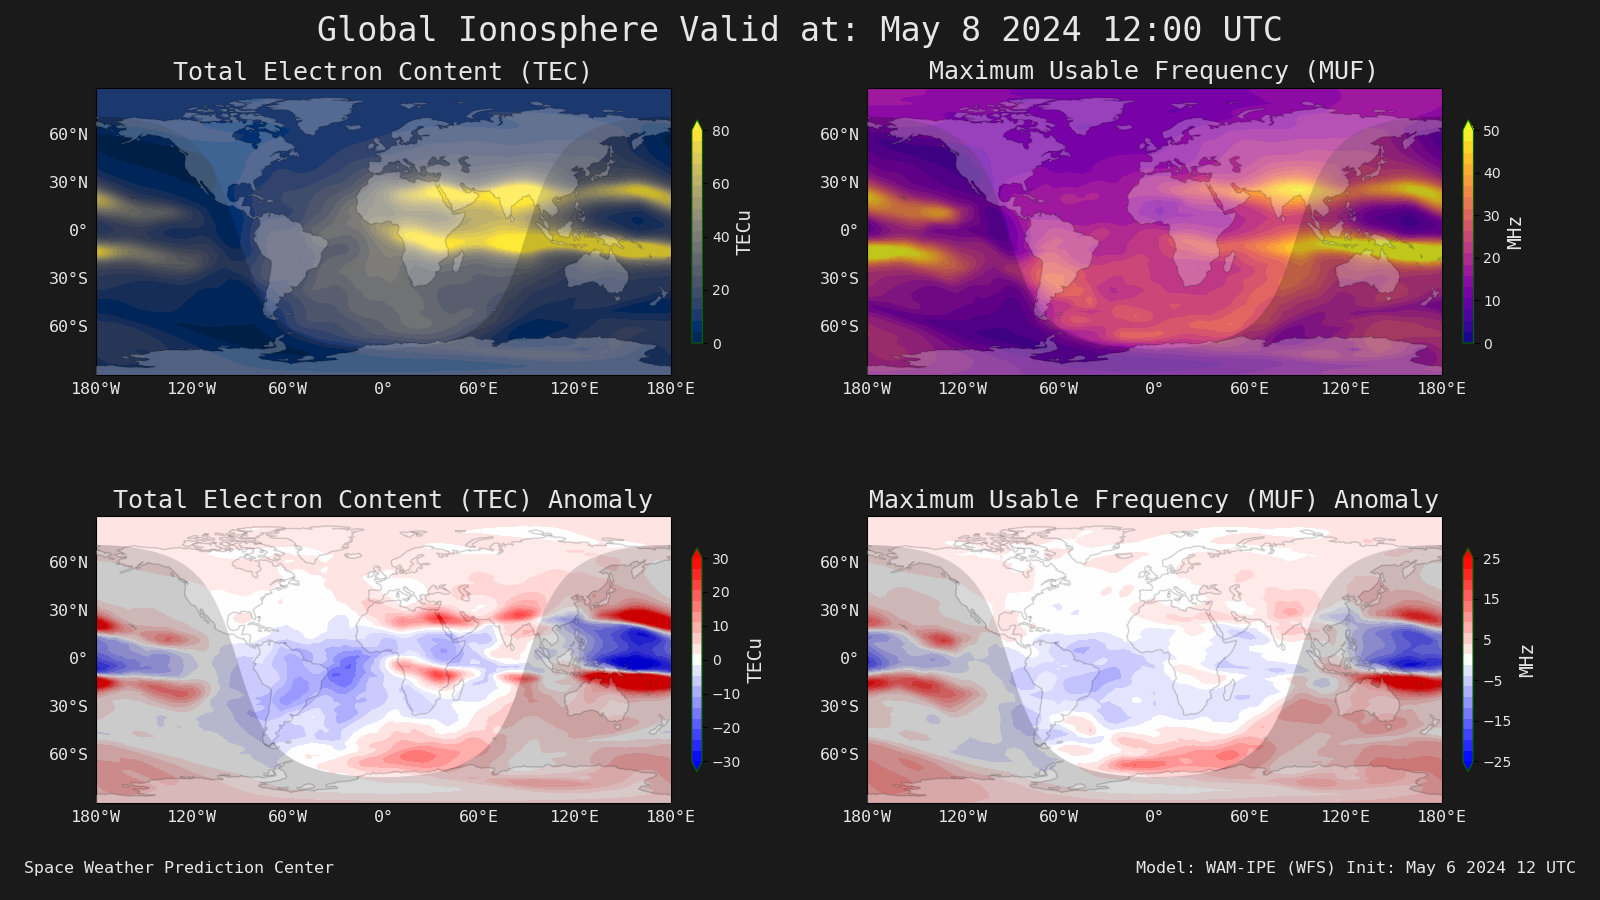 |
Prev Ionosphere Forecast 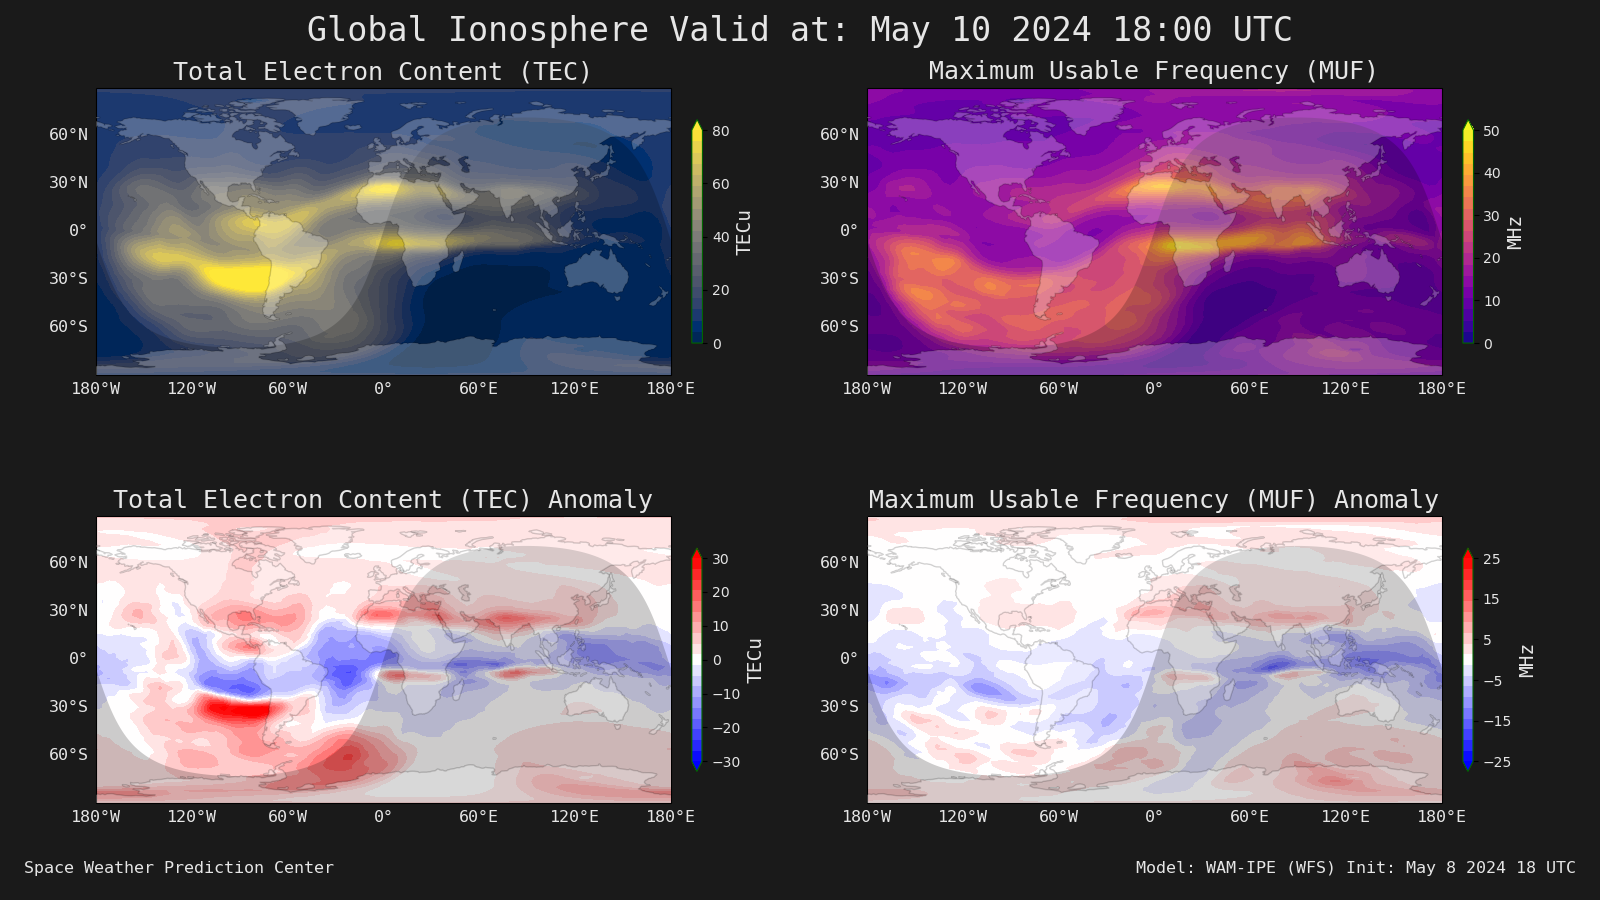 |
The coupled Whole Atmosphere Model-Ionosphere Plasmasphere Electrodynamics (WAM-IPE) Forecast System (WFS) provides a specification of ionosphere and thermosphere conditions with forecasts two days in advance in response to solar, geomagnetic, and lower atmospheric forcing. Model outputs provide guidance to the Space Weather Forecast Office (SWFO) at SWPC, supporting warnings and alerts related to aviation communication and Global Navigation Satellite System (GNSS). The real-time neutral density fields will also be available for orbit prediction and space traffic management purposes.
The WAM is an extension of the Global Forecast System (GFS) with a spectral hydrostatic dynamical core utilizing an enthalpy thermodynamic variable to 150 vertical levels on a hybrid pressure-sigma grid, with a model top of approximately 3 x 10⁻⁷ Pa (typically 400-600km depending on levels of solar activity). Additional upper atmospheric physics and chemistry, including electrodynamics and plasma processes, are included.
The IPE model provides the plasma component of the atmosphere. It is a time-dependent, global 3D model of the ionosphere and plasmasphere from 90 km to approximately 10,000 km. The flux-tube solver is based on the Field Line Interhemispheric Plasma (FLIP) model and flux-tube structures are defined by the International Geomagnetic Reference Field (IGRF). Seamless perpendicular plasma transport pole-to-pole and self-consistent electrodynamics are included.
WAM fields of winds, temperature, and molecular and atomic atmospheric composition are coupled to IPE to enable the plasma to respond to changes driven by the neutral atmosphere. The coupling is based on time-dependent 3D re-gridding in the space weather mediator. The model ingests solar wind and geomagnetic inputs, provided both by direct observation and as forecast by SWFO. The WAM-IPE Forecast System (WFS) provides products out to two days using these drivers as initialized by the data assimilation (DA) system.
The WAM state is updated using 3DVar DA in the lowest 60km of the atmosphere using a modified version of the Gridpoint Statistical Interpolation (GSI) software. An Incremental Analysis Update (IAU) method is used to apply the increment across the assimilation window to prevent the damping of tidal waves from the DA process. This comprises the WAM-IPE Data Assimilation System (WDAS).
The operational WAM-IPE is currently running in two different Concepts of Operation (CONOPS) to produce results of Nowcast and Forecast. The real-time nowcast system ingests real-time solar wind parameters every 5 minutes from NOAA’s spacecrafts located at Lagrange point 1 (L1) between the Sun and Earth in order to capture rapid changes in the ionosphere and thermosphere due to the sudden onset of geomagnetic storms. The nowcast is reinitialized every six hours to include the latest forcing from the lower atmosphere. The forecast system runs four times daily (0, 6, 12, 18 UT), providing two-day forecasts. Observed solar wind parameters are used whenever observational values are available, for the forecast portion, the forecasted 3-hour Kp and daily F10.7 issued by SWFO are ingested into the model to estimate solar wind parameters. Lower atmospheric data assimilation only carries out twice daily at 0 and 12 UT cycles to maintain the stability of the coupled model.
The top two panels show the latest global Total Electron Content (TEC) and Maximum Usable Frequency (MUF) as forecasted by the WAM-IPE. The bottom two panels show the anomaly in TEC and MUF taking the difference between the latest values and a 10-day running average at the same universal time. The forecast is updated with the latest real-time and forecast solar and geomagnetic drivers at 0, 6, 12 & 18 UT.
The top plot shows the neutral density at 400 km and the bottom left plot shows the thermospheric column O/N2 ratio. The anomaly of neutral density at 400 km is shown in the bottom right plot, which is the percentage difference between the latest values and a 10-day running average at the same universal time. The forecast is updated with the latest real-time and forecast solar and geomagnetic drivers at 0, 6, 12 & 18 UT.
Model output files out to 48 hours forecast can be accessed here.
Each directory contains 4x daily forecasts (initialized at 00, 06, 12, and 18 UT) of the ionosphere and neutral atmosphere model outputs. For each UT, the model starts from three hours prior to the initialization time in order to carry out the Incremental Analysis Update (IAU) for the WAM-IPE Data Assimilation System (WDAS). Each simulation provides a 48 hour forecast from the initialization time. Observed solar wind parameters are ingested as long as real-time observations are available. When real-time observations are unavailable, the simulation is driven by the forecasted Kp and F10.7 provided by the Space Weather Forecast Office.
Each tar file contains hourly chunks of 2-dimensional ionosphere outputs (TEC, NmF2, HmF2) at 5-min cadence (*ipe05*.nc) and 3-dimensional outputs (ion densities, temperature, ion drifts) at 10 min cadence (*ipe10*.nc), as well as 2-dimensional thermosphere outputs (neutral density at 400 km and column integrated O/N2 ratio) at 5-min cadence (*.gsm05*.nc) and 3-dimensional outputs on pressure levels (height, neutral temperature, neutral wind velocities, neutral density for O, O2 and N2). All the files are written in NetCDF format. Attributes hold metadata which include the timestamp of the forecast, with the filename being a convenient proxy.
Note that filenames might be overlapping in different folders due to the current naming conventions. A directory structure will be included in the next upgrade.