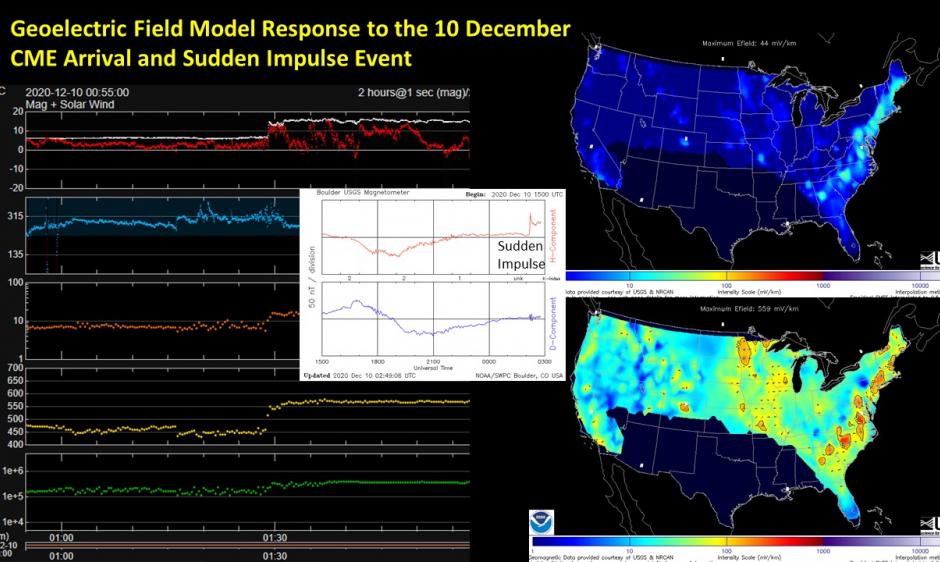
Effects from the CME that departed the Sun on 7 December, 2020, arrived at Earth early on the 10 December, 2020, UTC-day. The disturbed solar wind did not include a strong enough southward-directed magnetic field to initiate geomagnetic storm conditions. However, the CME-associated interplanetary shock was observed at the DSCOVR spacecraft at 10/0132 UTC (9 Dec, 8:32 pm ET) and then at Earth nearly 40 minutes later. The arrival of the CME shock front at Earth was detected as a Sudden Impulse (SI) by ground magnetometers that measure deviations in the Earth’s natural geomagnetic field in nanoteslas (nT). An SI is an instantaneous deviation in the northward component of the geomagnetic field at mid and low latitudes, and was observed in near-real time by the operational magnetometer network used at SWPC1. The Boulder magnetometer measured an SI of 30 nT 10/0211 UTC (9 Dec, 9:11 pm ET) that marked the arrival of the CME shock front at Earth. While, this SI was not followed by a geomagnetic storm, the SI was also seen in our operational geoelectric field model.
The geoelectric field model combines information about the time-varying magnetic field (as gathered from the magnetometer observatories) with Earth-conductivity information to estimate the geoelectric field in milliVolts/km. The geoelectric field can be integrated along conducting pathways to infer the induced voltage on power lines which leads to geomagnetically induced currents in the power grid. The geoelectric field model (shown in the graphic above) displays this information geographically, over the parts of the lower 48 states where conductivity information is available. The SI early on the 10 Dec UTC-day caused a brief but strong jump in the time-rate-of change of the geomagnetic field and consequently a corresponding jump in the geoelectric field model occurred across much of the continental U.S., with a maximum E-field value of ~550-570 mV/km. While the jump in the geoelectric field was not enough to cause problems for the power grid, the timely response of the model was an interesting demonstration of this product and indicates its valuable contribution to SWPC’s efforts to provide actionable information for the nation’s power grid operators. Visit the Regional Geoelectric 1-Minute (Empirical EMTF – 3D Model) available on our webpage to learn more.
1SWPC’s ground-based operational magnetometer network is operated in collaboration with our partner agencies: which includes the U.S. Geological Survey, Natural Resources Canada (NRCAN), the British Geological Survey, The German Research Center for Geosciences (GFZ), Geoscience Australia, Institut de Physique du Globe de Paris, and the Korean Space Weather Center.