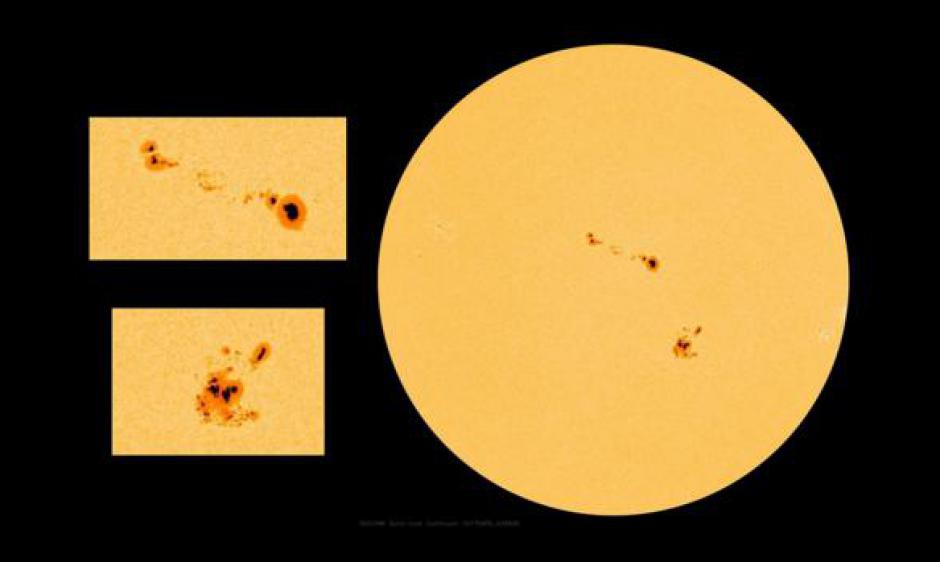
Sunspots are dark areas that become apparent at the Sun’s photosphere as a result of intense magnetic flux pushing up from further within the solar interior. Areas along this magnetic flux in the upper photosphere and chromosphere heat up, and usually become visible as faculae and plage – often times termed active regions. This causes cooler (7000 F), less dense and darker areas at the heart of these magnetic fields than in the surrounding photosphere (10,000 F) - seen as sunspots. Active regions associated with sunspot groups are usually visible as bright enhancements in the corona at EUV and X-ray wavelengths. Rapid changes in the magnetic field alignment of sunspot groups’ associated active regions are the most likely sources of significant space weather events such as solar flares, CMEs, radiations storms, and radio bursts.
Sunspots appear in a wide variety of shapes and forms. The darkest area of a sunspot (also the first to be observed) is called the umbrae. As the sunspot matures (becomes more intense), a less dark, outlying area of well-defined fibril-like structure develops around the umbrae - called penumbra. Sunspots can grow from an individual unipolar spot into more organized bipolar spot groups; or even evolve into immense, very complex sunspot groups with mixed magnetic polarities throughout the group. The largest sunspot groups can cover large swaths of the Sun’s surface and be many times the size of Earth.
Sunspot groups that are clearly visible and observed by designated ground-based observatories, are assigned a NOAA/SWPC 4-digit region number to officially record and track the sunspot group as it rotates across the visible solar disk. Sunspot groups are analyzed and characterized based on their size and complexity by SWPC forecasters each day using the modified Zurich classification scale and Mount Wilson magnetic classification system. This daily sunspot analysis and classification is submitted at the end of each UTC-day as the Solar Region Summary report.
Sunspots can change continuously and may last for only a few hours to days; or even months for the more intense groups. The total number of sunspots has long been known to vary with an approximately 11-year repetition known as the solar cycle. The peak of sunspot activity is known as solar maximum and the lull is known as solar minimum. Solar cycles started being assigned consecutive numbers. This number assignment began with solar cycle 1 in 1755 and the most recent being cycle 24 – which began in December, 2008 and is now nearing solar minimum. A new solar cycle is considered to have begun when sunspot groups emerge at higher latitudes with the magnetic polarities of the leading spots opposite that of the previous cycle. A plot of sunspot number progression for the previous and current solar cycle, and that compares the observed and smoothed values with the official sunspot number forecast provided by the Solar Cycle Prediction Panel representing NOAA, the International Space Environmental Services (ISES), and NASA is available to view on our SWPC webpage at solar cycle progression.
The official daily and monthly sunspot numbers are determined by the World Data Center – Sunspot Index and Long-term Solar Observations (WDC-SILSO (link is external)) at the Royal Observatory of Belgium. Generally, sunspot reports from observatories calculate sunspot numbers whereby each sunspot group counts as 10, and every umbra within each spot group is individually considered as 1. Therefore, no sunspots on the visible Sun would be considered as zero; while the next possible number can only be 11 or higher.
More detailed information about sunspot number concepts and a thorough perspective about the solar cycle, can be learned by reading the scientific paper: “Revisiting the Sunspot Number, a 400-year perspective on the Solar Cycle” by F. Clette, L. Svalgaard, J. Vaquero, and E. Cliver; Space Sci Rev (2014) 186:35-103; DOI 10.1007/s11214-014-0074-2
*IMAGES courtesy of NASA