

NOTE: As of 6/21/2023, this product, the Regional Geoelectric 1D, which covered only the continental US, has been updated with a new model that covers both the US and Canada at the Geoelectric Field Models (US Canada 1D & 3D EMTF CONUS) page. The new page provides both the US-Canada 1-D model and the 3D EMTF CONUS model.
The Geoelectric Field is a measure of the induction hazard to artificial conductors, such as electrical power lines, that results from Geomagnetic Activity, and can be used to estimate the amount of current induced by integrating along the conducting pathway.
The near real-time E-field mapping project is a joint effort between NOAA/SWPC, the USGS geomagnetism group, and the NASA/CCMC.
Background
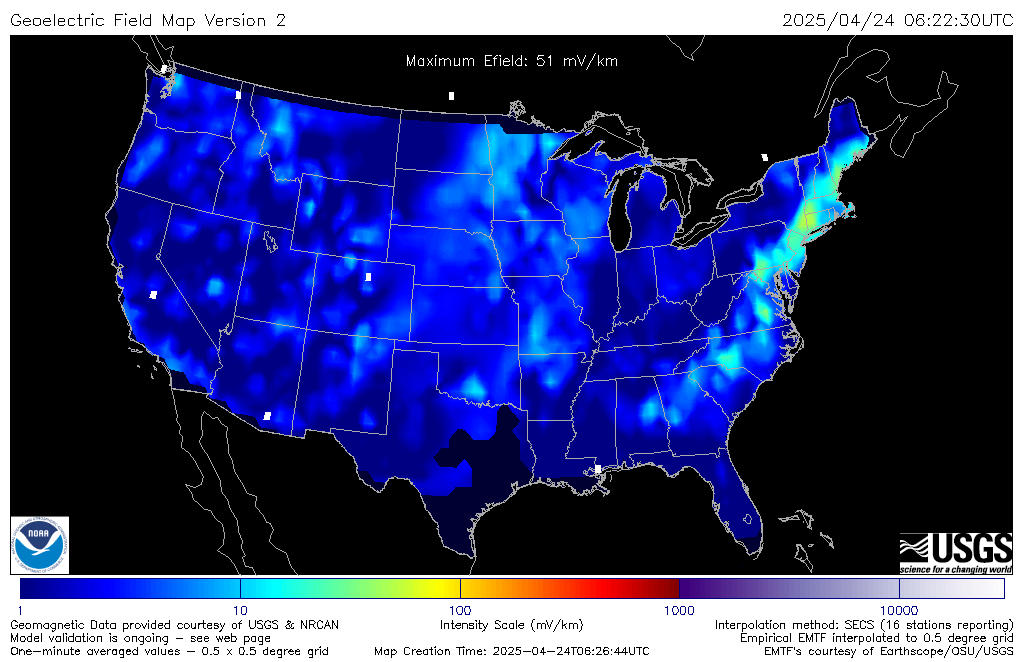
Potentially hazardous geoelectric fields can be induced during geomagnetic storms. These geomagnetic storms are a form of space weather driven by enhanced currents in Earth's magnetosphere and ionosphere and are observed at ground level as a time-varying magnetic field. As is well known from Faraday's law, a time-varying magnetic field induces currents along natural and artificial conducting pathways. This geoelectric field product combines information about the time-varying magnetic field together with available Earth-conductivity information to estimate regional geoelectric field levels on a geographic grid over the lower 48 states. The amount of current induced in an artificial conductor may be calculated by integrating along the conducting pathway. When currents are induced in artificial conductors, unexpected and sometimes problematic effects can occur in the operation of the affected equipment. Please see our article about the effect this has on electrical power systems at https://www.swpc.noaa.gov/impacts/electric-power-transmission. Please see also the article Modeling geomagnetically induced currents, by Boteler and Pirjola in Space Weather (31 January 2017), for an up-to-date description of this phenomena.
Versions and Caveats:
The version of this product using 1D physiographic conductivity models is based on analysis published by Fernberg (2012). Users please note that we are planning to release an upgraded version of the Geoelectric Field Maps in FY2020, derived by using Empirical Magnetotelluric Transfer Functions (EMTF's) (see Kelbert et al., 2011 for details), which provide an Earth Conductivity description that incorporates the full 3D effects of Earth conductivity structures. Future upgrades are also anticipated depending on the development of state-of-the-art three-dimensional (3D) electrical conductivity models obtained with magnetotellurics (Meqbel et al., 2014; Yang et al., 2015; Murphy & Egbert, 2017) and global electromagnetics (Sun et al., 2015). The upgraded versions of the maps will follow the same output format as the 1D Geoelectric Field Maps, and the newer services will be provided experimentally before final operational release to facilitate scientific research, validation, and initial familiarization for the operators.
Users should note specifically that 1D Geoelectric Field Maps, as currently released (Fernberg 2012), are in need of validation against geoelectric field or geomagnetically induced current measurements. Recent research (e.g. Bedrosian & Love, 2015; Weigel, 2017; Bonner & Schultz, 2017; Kelbert et al., 2017), and initial comparisons with EMTF-based calculations suggest that in some regions, this approximation for the Earth's structure does not hold and the geoelectric field estimation could be substantially inaccurate. We welcome collaborations from the user community to participate in the ongoing validation analysis that is needed. Retrospective E-field maps are available, for example, for the September 07-08, 2017 geomagnetic storm (for both this initial model and for the newer EMTF model) which can be tested using systems models and measurements. SWPC is also retaining the 1D Fernberg gridded E-field output results which go back to the initial experimental release in October 2017. It is also possible for us to run simulations retrospectively using different conductivity models for earlier periods of interest to our industry collaborators.
At this time, we advise caution in the utilization of the 1D Geoelectric Field Maps for operational mitigation of geomagnetic hazards. We hope, however, that the release of this product will facilitate additional research on geomagnetic hazards and validation activities within the power-grid industry and will help operators have better situational awareness during geomagnetic storms. Operational and research workflows developed with the use of the 1D Geoelectric Field Maps will be directly portable to the upgraded versions once they are available. We invite development of such workflows, which would dramatically assist us with validation efforts.
Acknowledgements:
Key data provider agencies are gratefully acknowledged for their contributions:
-The U.S. magnetometer observatories are operated and maintained by the U.S. Geological Survey
-The near U.S. Canadian observatories are operated and maintained by NRCAN
The maps use a geomagnetic-field time series interpolation algorithm (Spherical Elementary Current Systems) developed and made available courtesy of the Finnish Meteorological Institute (Amm & Viljanen, 1999; Pulkkinen et al., 2003)
Results from the NSF's EarthScope USArray project with contributions from a survey of Florida by USGS are being used as the source for the development of the improved EMTF-based and 3D Earth conductivity models which will be incorporated in the Geoelectric Field Map upgrades as discussed above. (see Kelbert et al. 2011 and Bedrosian et al. 2015)
Technical advice from David Boteler, NRCAN, is gratefully acknowledged.
References:
Amm, O. & A. Viljanen (1999). Ionospheric disturbance magnetic field continuation from the ground to the ionosphere using spherical elementary current systems, Earth Planets Space, 51, 431-440.
Bedrosian, P.A., A Kelbert, B.L. Burton, J.R. Morris, and C. Blum (2015). Long Period Magnetotelluric Transfer Functions from the Florida Peninsula. doi:10.17611/DP/EMTF/USGS/GEOMAG/FL15
Bedrosian, P. A., & Love, J. J. (2015). Mapping geoelectric fields during magnetic storms: Synthetic analysis of empirical United States impedances. Geophysical Research Letters, 42(23).
Bonner, L. R., & Schultz, A. (2017). Rapid prediction of electric fields associated with geomagnetically induced currents in the presence of three‐dimensional ground structure: Projection of remote magnetic observatory data through magnetotelluric impedance tensors. Space Weather, 15(1), 204-227.
Boteler, D. & R. Pirjola (2017), Modeling geomagnetically induced currents, Space Weather, DOI10.1002/2016SW001499 (31 January 2017).
Fernberg 2012, One-Dimensional Earth Resistivity Models for Selected Areas of Continental United States and Alaska, EPRI Technical Update 1026430, Palo Alto, CA.
Kelbert, A., G.D. Egbert and A. Schultz (2011), IRIS DMC Data Services Products: EMTF, The Magnetotelluric Transfer Functions, https://doi.org/10.17611/DP/EMTF.1
Kelbert, A., Balch, C. C., Pulkkinen, A., Egbert, G. D., Love, J. J., Rigler, E. J., & Fujii, I. (2017). Methodology for time‐domain estimation of storm‐time geoelectric fields using the 3D magnetotelluric response tensors. Space Weather.
Meqbel, N. M., Egbert, G. D., Wannamaker, P. E., Kelbert, A., & Schultz, A. (2014). Deep electrical resistivity structure of the northwestern US derived from 3-D inversion of USArray magnetotelluric data. Earth and Planetary Science Letters, 402, 290-304.
Murphy, B. S., & Egbert, G. D. (2017). Electrical conductivity structure of southeastern North America: Implications for lithospheric architecture and Appalachian topographic rejuvenation. Earth and Planetary Science Letters, 462, 66-75.
Pulkkinen, A., O. Amm, A. Viljanen, et al. (2003). Separation of the geomagnetic variation field on the ground into external and internal parts using the spherical elementary current system method, Earth Planets Space, 55, 117-129.
Sun, J., Kelbert, A., & Egbert, G. D. (2015). Ionospheric current source modeling and global geomagnetic induction using ground geomagnetic observatory data. Journal of Geophysical Research: Solid Earth, 120(10), 6771-6796.
Weigel, R. S. (2017). A comparison of methods for estimating the geoelectric field. Space Weather, 15(2), 430-440.
Yang, B., Egbert, G. D., Kelbert, A., & Meqbel, N. M. (2015). Three-dimensional electrical resistivity of the north-central USA from EarthScope long period magnetotelluric data. Earth and Planetary Science Letters, 422, 87-93.
Archive maps and data for the 1D (Fernberg 2012) Geoelectric Field Maps are available by request.